Visible High Low
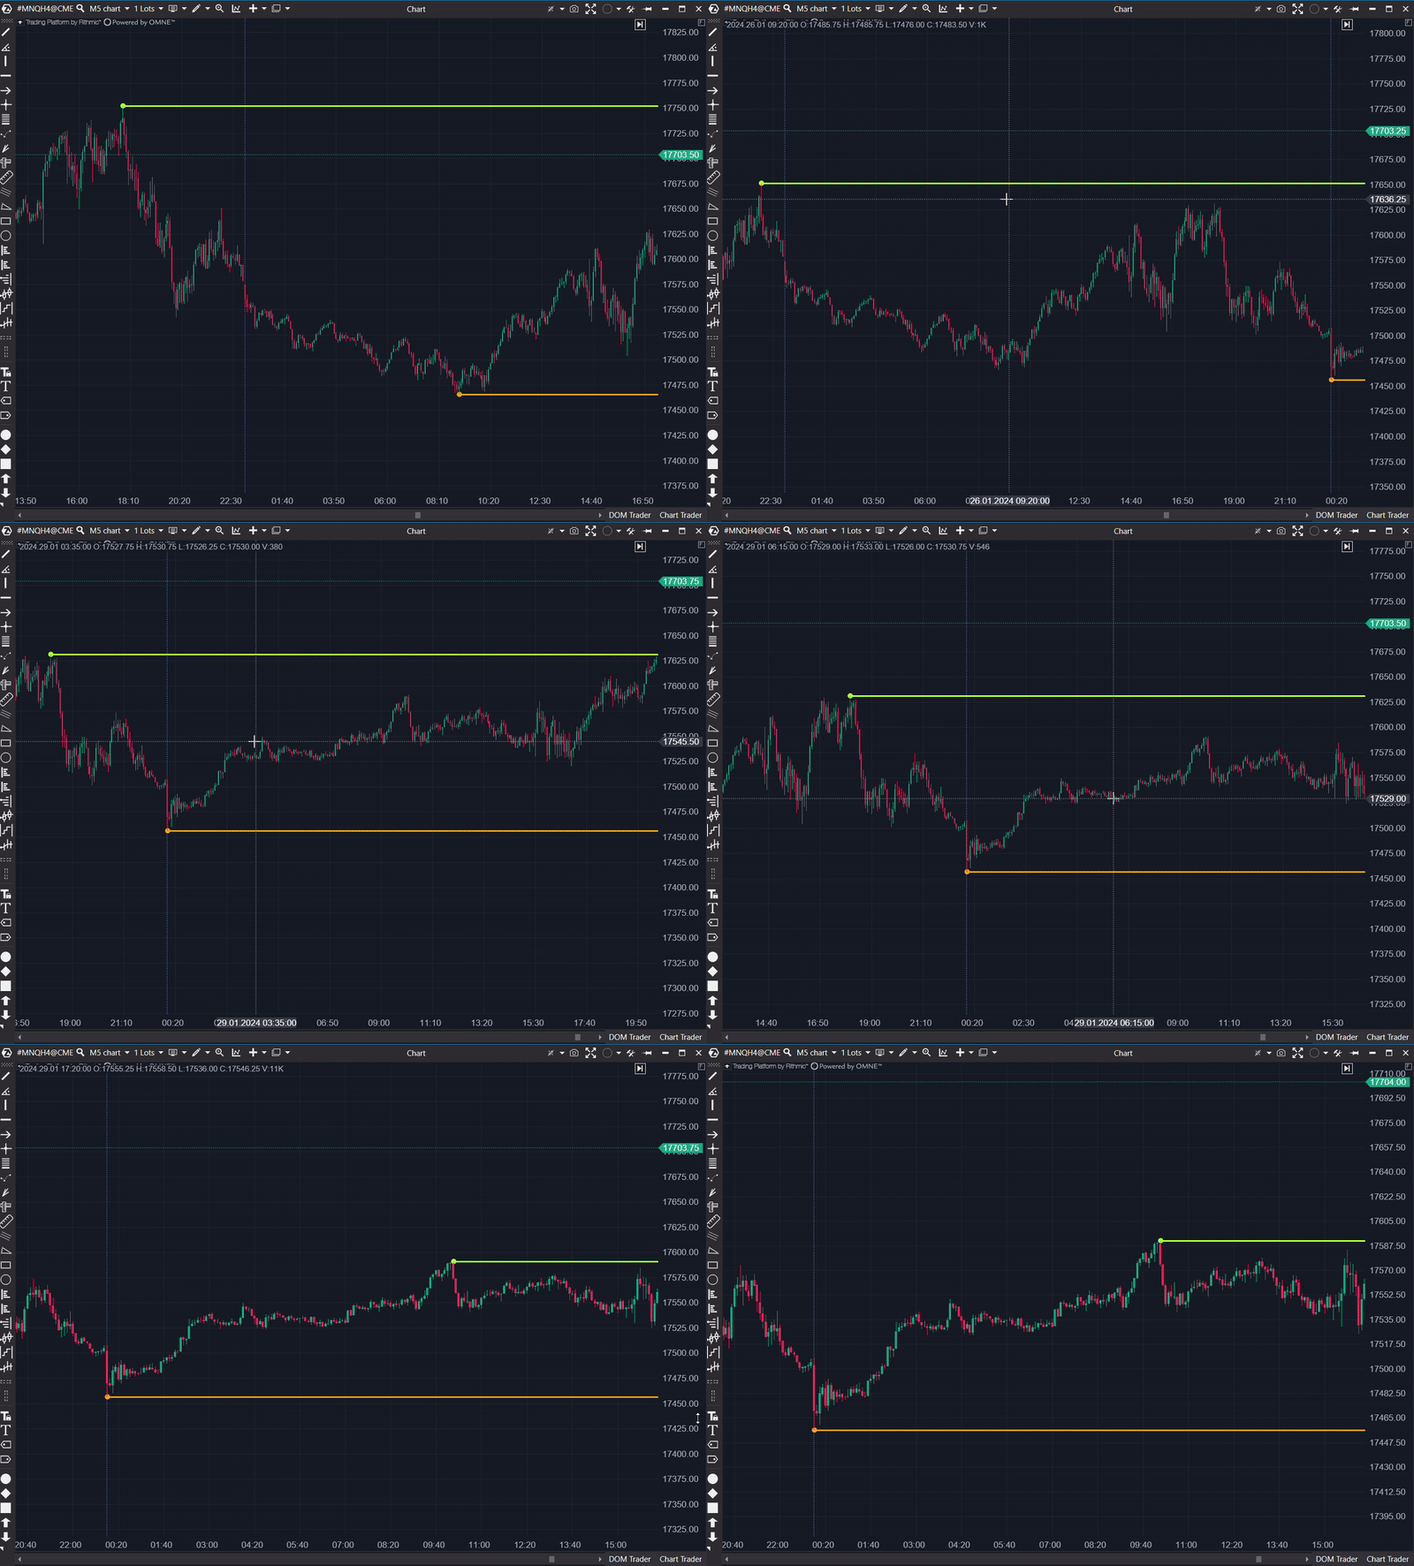
ATAS indicator to find the highs and lows in the currently visible timeframe
How it works
This indicator displays the highest high and the lowest low in the current timeframe. As you scroll through the chart in ATAS, the displayed high and low change in real-time.

What can I use the indicator for?
Trend Identification
This indicator helps in identifying the prevailing market trend by highlighting the highest highs and lowest lows. Traders can use these points to discern whether the market is in an uptrend or downtrend, aiding in strategic entry and exit decisions.
Breakout Confirmation
By marking the extreme points within a given timeframe, the indicator can serve as a tool for confirming breakouts. When the price breaks beyond these levels, it may signal the start of a new trend or the continuation of an existing one, offering a clear signal for traders to act.
Stop-Loss Placement
The highest high and lowest low can provide logical points for setting stop-loss orders. Traders can position their stop losses just below or above these levels to protect against market reversals while minimizing potential losses.
Support and Resistance
These extreme points can also indicate key levels of support and resistance within the market. Identifying these levels allows traders to anticipate potential turning points or consolidation areas, facilitating more informed trading decisions based on price action.

Settings
Extend Lines: Extend the horizontal lines to the right edge of the chart instead of up to the current candle.
High Color: Color of the line marking the high in the current timeframe.
Low Color: Color of the line marking the low in the current timeframe.
