Colored Area
Visual Range Indicator for ATAS: Enhancing Market Clarity and Precision
How it works
This indicator draws a colored area within a chosen panel, highlighting a defined range based on the upper and lower values you set.
As market data fluctuates, the indicator visually emphasizes when key levels — such as overbought or oversold thresholds — are reached or crossed, allowing traders to quickly identify potential trend reversals and significant price actions.

What can I use the indicator for?
ATR-Based Volatility Zone
Use the indicator on an ATR panel to highlight periods of changing volatility. Setting the upper and lower thresholds to multiples of ATR allows you to quickly see when the market becomes more volatile, helping adjust stop-loss distances and position sizes accordingly.
Volume Threshold Highlighting
Apply the indicator to a volume panel to define a normal range for trading activity. A colored area marking typical volume levels can alert you when volume spikes or drops significantly, indicating potential trend reversals or breakout opportunities.
MACD Signal Range Identification
Use the indicator on a MACD panel to mark a specific range around the MACD signal line. This visual zone helps you quickly identify when the MACD is approaching key levels, making it easier to spot potential momentum shifts or trend reversals based on divergences between the MACD line and its signal line.
ADX Range Visualization
Display the ADX indicator with a highlighted range to easily identify shifts in trend strength. When ADX values move out of the preset range, it provides a visual cue that the current trend may be gaining or losing momentum, prompting further analysis.
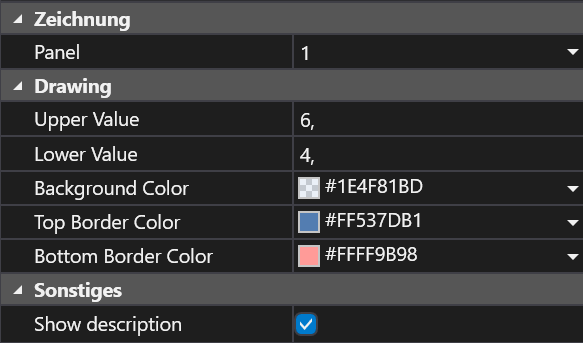
Settings
Panel: The specific chart panel where the colored area will be displayed. Usage: Select the indicator panel (e.g., for the ATR, Volume, or any other technical analysis tool).
Upper Value: The top boundary of the highlighted area. Usage: Set the value that represents the upper threshold (e.g., 80 for overbought conditions).
Lower Value: The bottom boundary of the highlighted area. Usage: Set the value that defines the lower threshold (e.g., 20 for oversold conditions).
Background Color: The fill color for the area between the upper and lower values. Usage: Choose a color that contrasts well with your chart for clear visibility.
Top Border Color: The color of the line outlining the upper edge of the highlighted area. Usage: Pick a color that distinctly marks the upper boundary.
Bottom Border Color: The color of the line outlining the lower edge of the highlighted area. Usage: Select a color that clearly defines the lower boundary.